
We have worked with our fair share of business intelligence (BI) tools, but Microsoft Power BI happens to be our favorite. It contains a lot of robust charting and reporting features, and it is well supported by the Microsoft ecosystem.
If you have toiled in the SQL Server, MS Access, and Excel woods throughout your career, then Power BI is a logical next step if you are curious about working with a business intelligence platform.
Power BI’s “querying” feature functions like Excel on steroids and creating calculated fields — through their DAX library of functions and operators — behave similarly in logic to writing advanced formulas in Excel, as well.
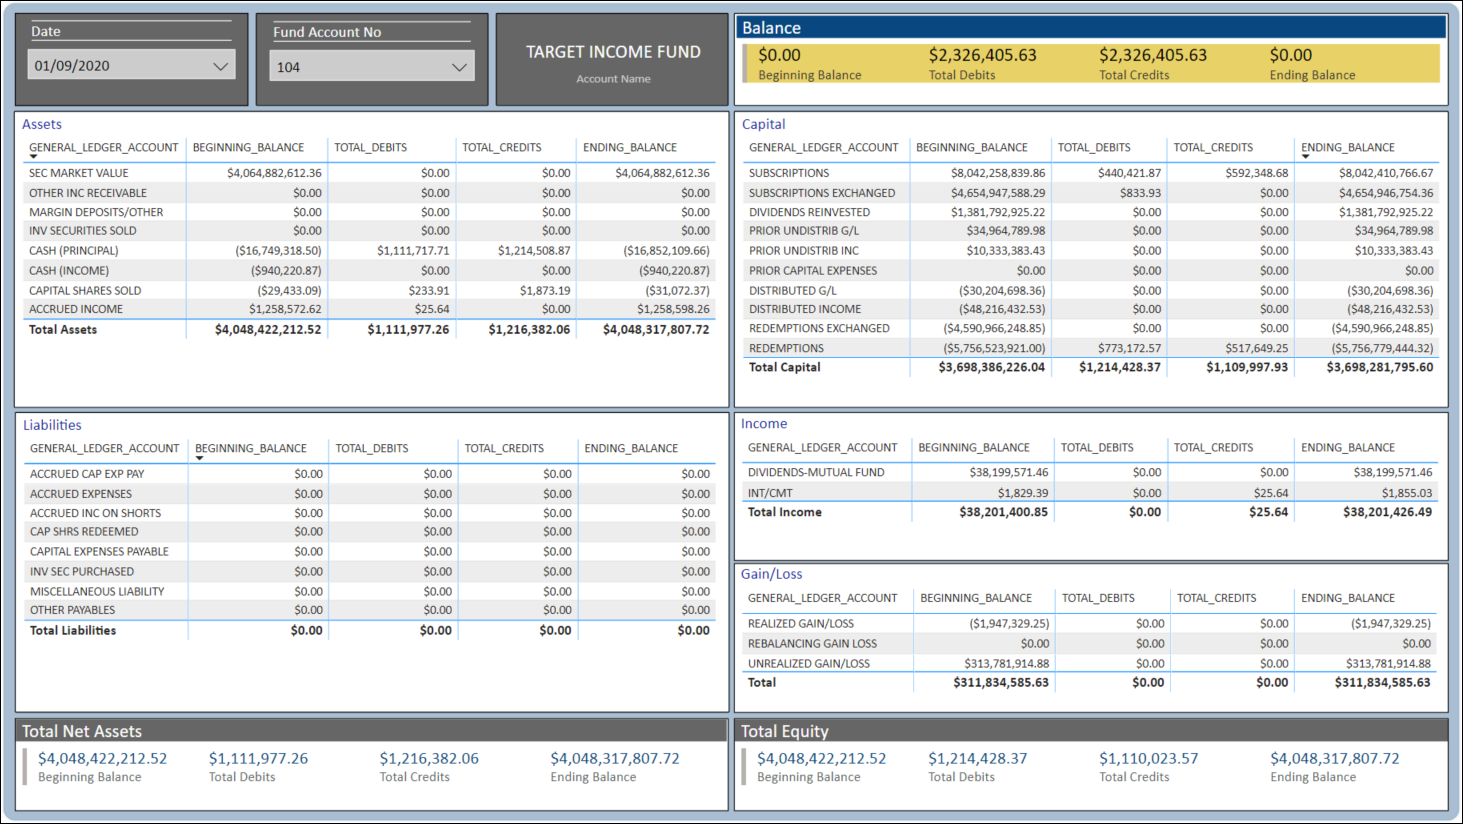
The Report
The business intelligence artifact above simulates a back-office “Trial Balance” report using daily chart of accounts/general ledger data.
Using a PDF version of this report as our primary model, we determined that the following structure would need to be maintained:
- Assets, Liabilities, Capital, Income, and Gain/Loss should be separately grouped and totaled on a per fund basis
- The totals for Assets and Liabilities should be calculated to derive “Total Net Assets,” and the totals for Capital, Income, and Gain/Loss should be calculated to derive “Total Equity”
- The net results of Total Net Assets and Total Equity should produce the final “Balance” amount (Beginning and Ending Balances net to zero (0), Debits and Credits are summed and should be equal)
- The report should be drawing from a filtered subset of a raw dataset
The second and third calculated fields mentioned above can be derived by using Power BI’s DAX feature as seen below.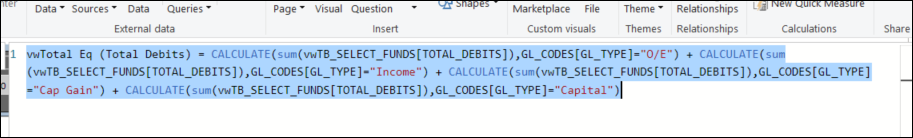
The Challenge
From a real-life business perspective, we saw opportunities for Power BI to streamline the following areas from the original version.
- Remove the need for delivering an electronic copy of the report daily
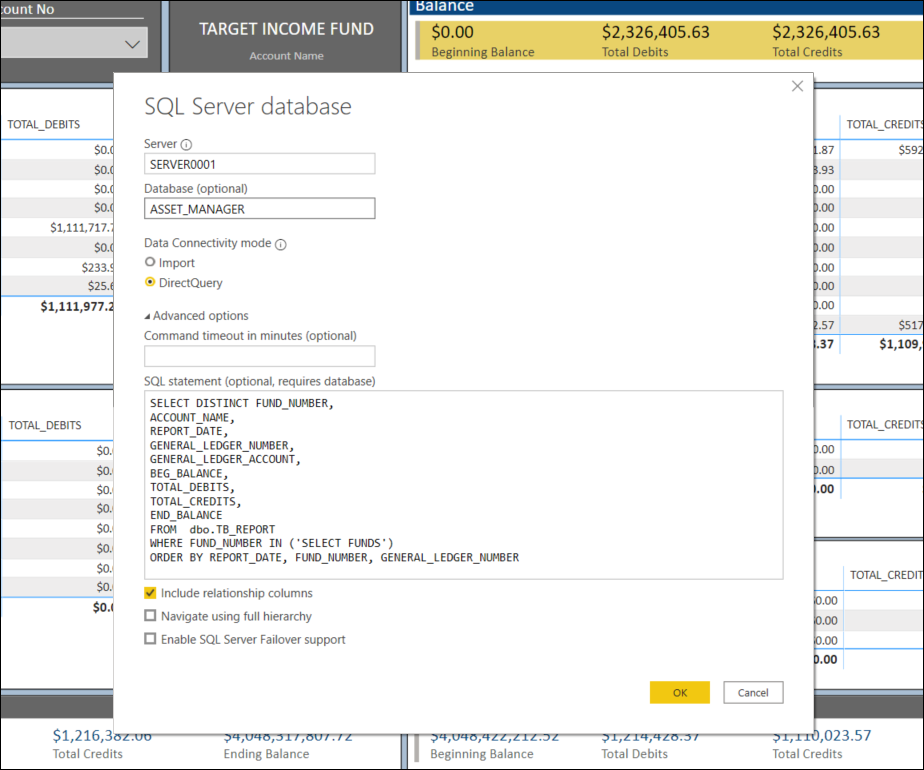
- Simplify and filter the data pull through either a SQL view or query in Power BI
- Consolidate the report to one “view,” so a user does not have to scroll through multiple pages of the PDF version to review more than one account
- Maintain more control over the administration of the report rather than relying solely on the data/database team(s)
- Eliminate the need to store electronic copies of the report and remove inefficiency from having to manually data-mine PDF versions of the report for later reference
The Result
When creating reports in Power BI, you can create it locally and then publish it to a shared web workspace. Since its connection to the data source has already been established, there is no need to maintain the data upkeep as long as the source tables are updating.
And instead of connecting the report to the raw data source where there may be superfluous fields updating in your BI environment, Power BI allows you to set up your data source using a SQL query targeting your specific data (see illustration above).
Lastly, since you would be able to access the report dashboard through the web, there is no longer a need to manage the storage of those PDFs on your own. Just navigate to your BI report and select the date value that you want to review.
Get in Touch!
![]()
If you want to explore how Basis Points Technology can assist you with your Business Intelligence reporting needs, navigate to our contact form or email us at info@basispointstech.com.