
Spreadsheet applications such as Microsoft Excel, Google Sheets, and Airtable can perform many invaluable functions for an individual or company team. Financial analysts, managers, and technologists use them for data analysis, record tracking, calculating, forecast/modeling, and even as small-scale applications.
As any consultant can tell you, the ability to adapt to all kinds of working conditions and constraints for any given project comes with the job. On some projects, if you are lucky, you may be given limited access inside a client’s firewall and to their enterprise tools — some of which you may need for the work you were brought on to perform.
Often enough, we find ourselves tapping into our inner hinterlands of creativity to be able to keep aspects of a project flowing smoothly, and spreadsheets usually played a significant role when we think back on what contributed to it.
The Ubiquity of Spreadsheets
For any given project, you may join a team structure involving not only internal and client members, but with other consulting groups and third parties such as vendors and service providers. With disparate company policies between all parties, having a centralized collaboration tool may be difficult to achieve and set up once a project commences. Typically, this is a scenario where spreadsheets come into play as they generally seem to be the favored tool that all personalities acquiesce to due to their flexibility and lack of potential “learning curve” obstacles on other products (one person/team may know the product versus the other(s)).
As easy it is to generate a new spreadsheet file, populate it with information, build out its structure, functionality, and place it on a network file-sharing environment for others to access, we found it took just a little more time to build out similar artifacts using Airtable and their library of templates. Most everything else about building out an Airtable spreadsheet behaves in the same manner as an Excel or Google Sheets artifact.
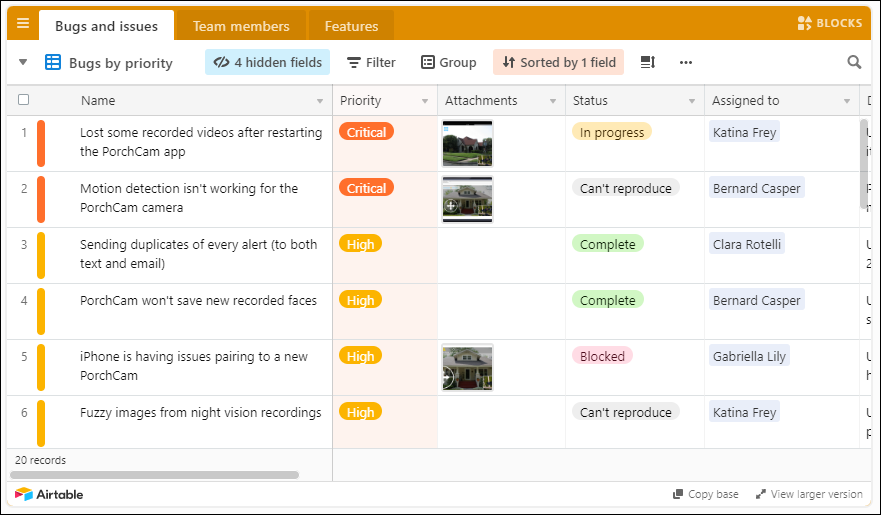
We imported Airtable’s “Bug tracker” template (see above) into our dedicated workspace and modified, added, and removed tabs, fields, and functionality that specifically suited our needs.
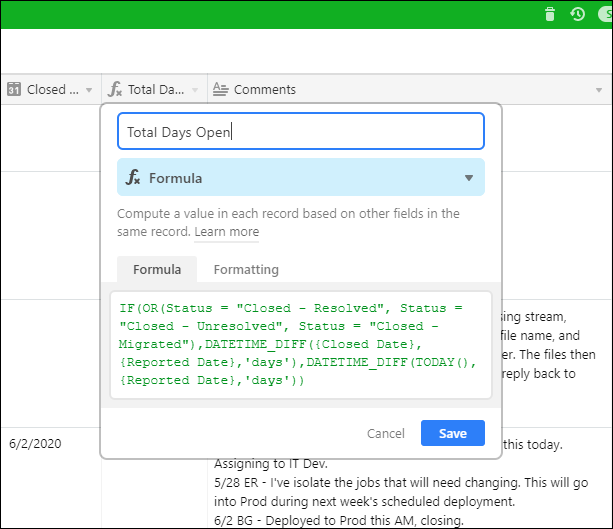
And like Excel, you can create custom fields in Airtable using advanced formulas such as the IF function that we generated below to calculate Total Days Open for an issue.
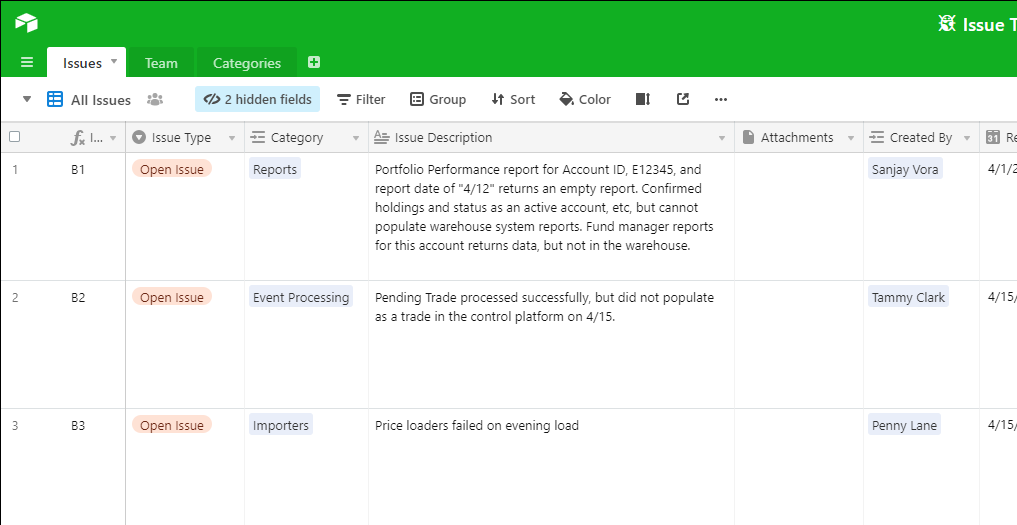
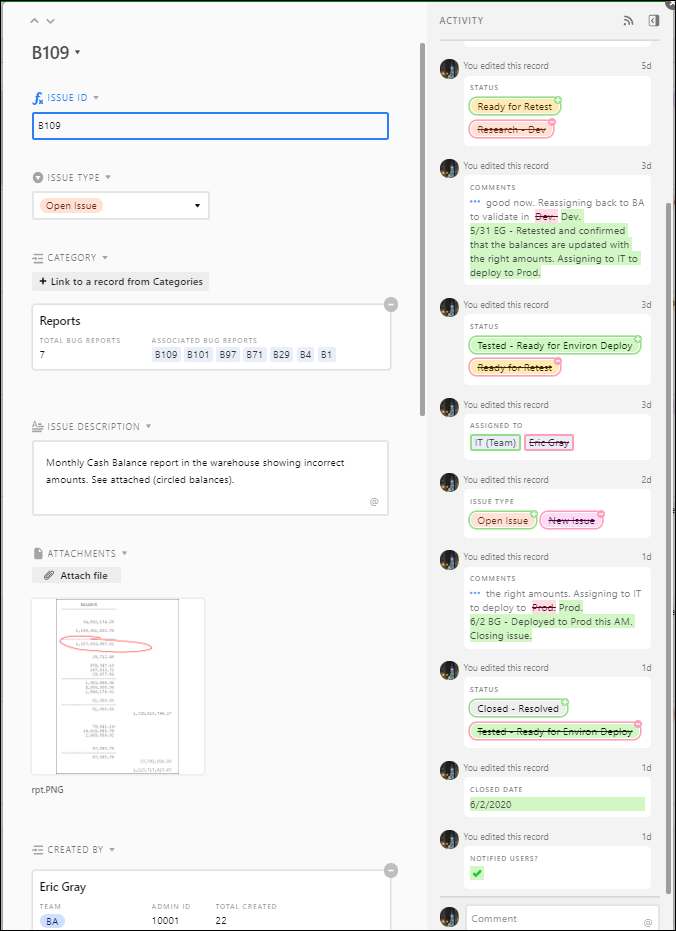
One of the best benefits about Airtable’s bug tracker template compared to Excel or other standard spreadsheet platforms is that this template already behaves like a full-service bug/issue tracking application. When adding a new record/row in the default spreadsheet view, it will bring up a form view like the one you see below for entering new information or editing existing fields. (The free account version shows two weeks of revision history, as well.)
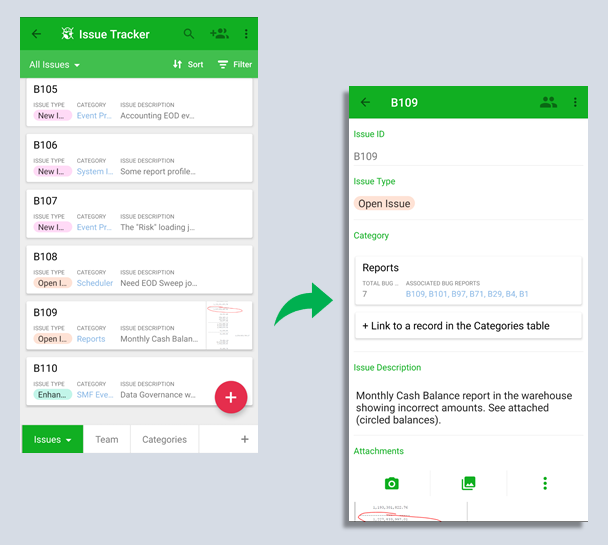
And we can also access Airtable through their mobile platform, which provides a condensed and fully functional view of our issue tracker as illustrated below.
Integrating with Power BI through APIs
Even though Airtable offers some impressive charting features, presently it requires an upgrade “Pro” account inclusive with features that are superfluous to our needs. Instead, we integrated our Airtable issue tracker with a Microsoft Power BI report.
Airtable offers standard API integration, so we established the APIs as three separate Power BI data sources (category, team, and issues) to account for each of the worksheets in the tracking platform. However, we found out the hard way during our testing that Airtable limits 100 records per unique API call, so if one of your sheets contain more than 100 rows, the extraneous records will be dealt as sacrificial lambs.

After hours of internet research, coding, and testing for a workaround, we settled on adjusting our API calls as Python-coded scripts since this enterprising gentleman figured out how to get around this Airtable limitation. And since our Python scripts essentially convert JSON data to pandas dataframes, we named our Power BI tables as such (df = dataframe, py = Python), so that we can instantly determine that these tables are dataframes.

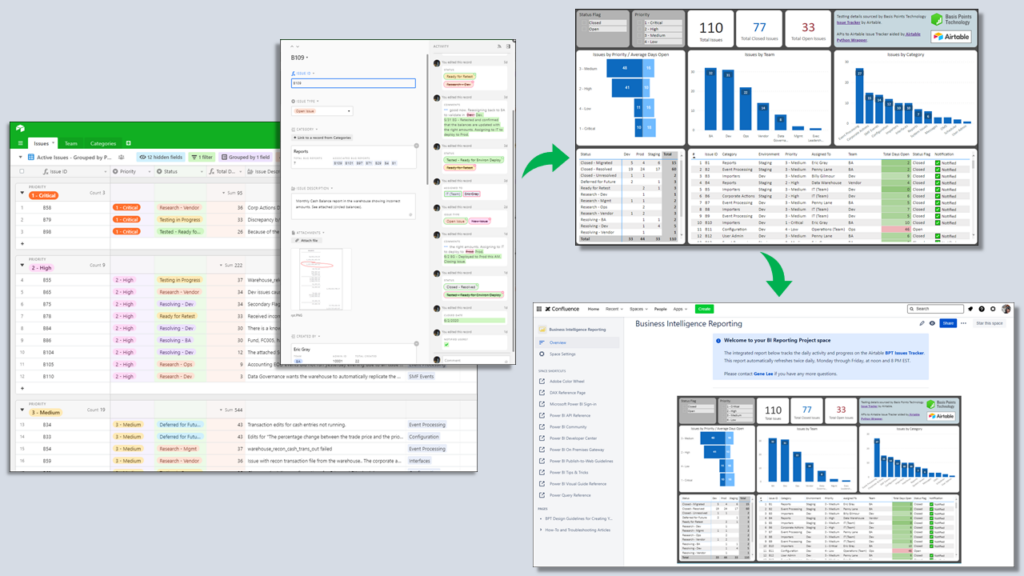
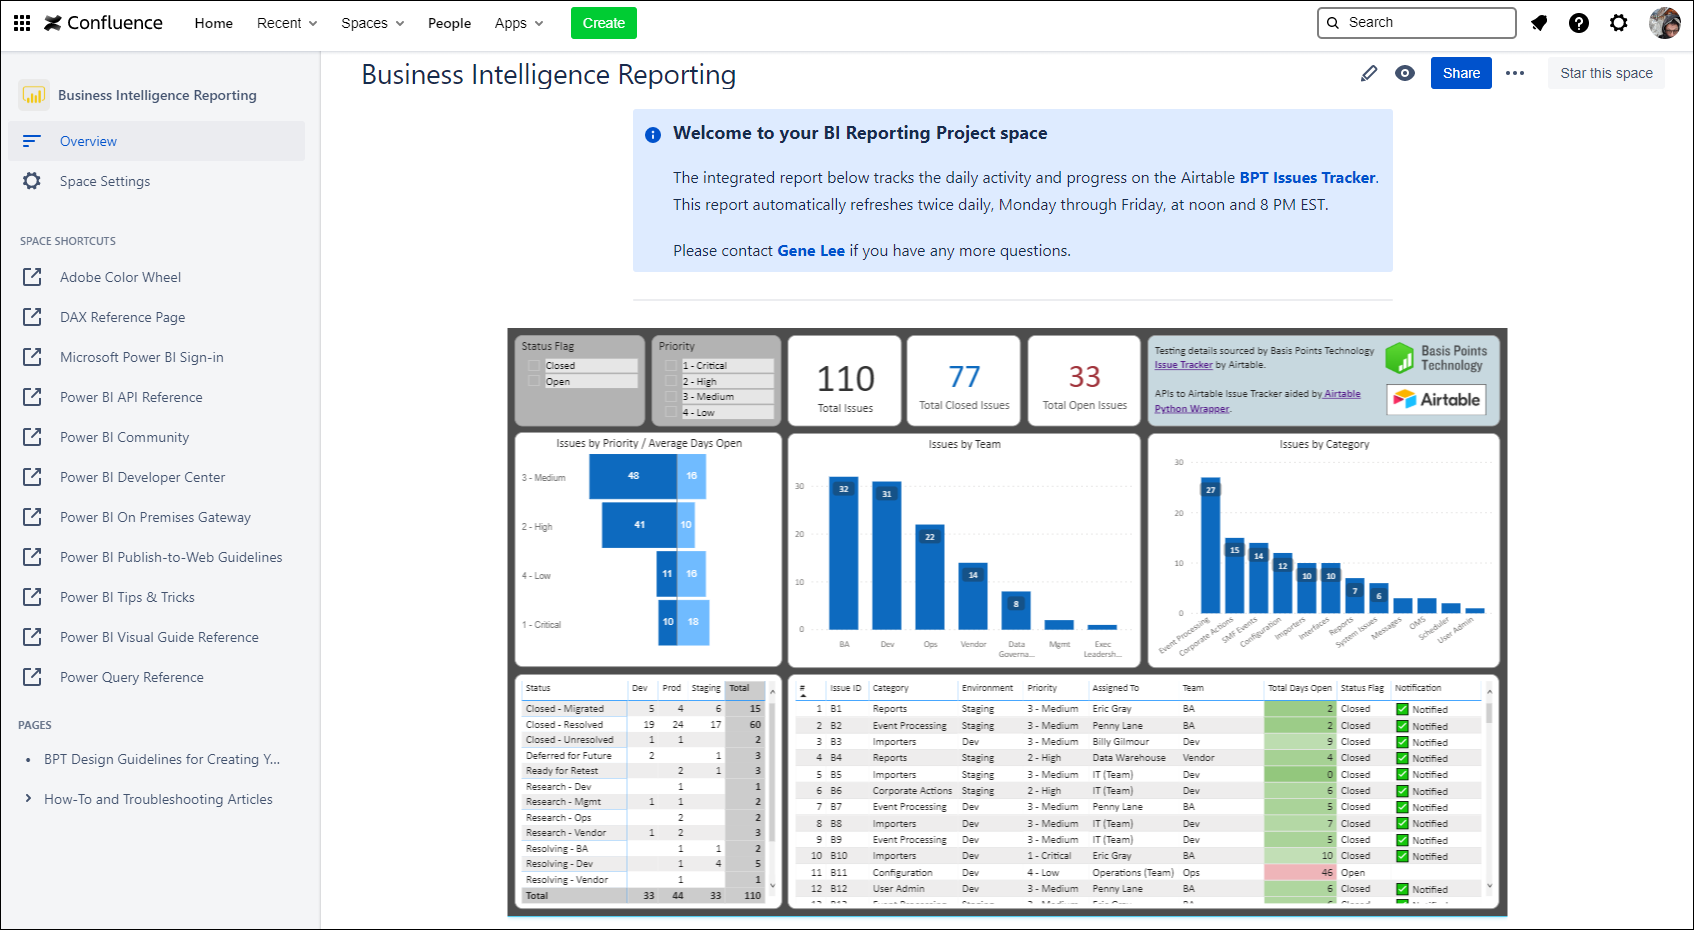
The integrated Power BI report as depicted above allows us to toggle between “Open” and “Closed” issues fed from our Airtable issue tracker and filter by Priority using the slicers. The interactive bar charts provide drilled-down observations integrated with the table visualizations that can be useful if you want to see the specific issues tied to a team or issue category.
As discussed in our previous blog post, we can automate scheduled refreshes through the web instance of Power BI, so we can keep our BI report as current as we like.
Lastly, we published an embedded version of this BI report on our Confluence project page where more team members (including management) can view and interact with it (see below).
Conclusion
Stand-alone spreadsheets provide immense flexibility to our daily work lives, but sometimes it is a good idea to take a step back and assess how you can take your modeling, tracking, and reporting functions to the next level. As the data and complexity of your spreadsheet increases, its integrity and performance tend to move in the opposite direction.
Our Airtable issue tracker moves our data entry and storage into a cloud model, and we attain an immediate out-of-the-box platform inclusive with standard API integration and web-based accessibility through our desktop and mobile phones.
Get in Touch!

If you want to explore how Basis Points Technology can assist you with your integration or Business Intelligence reporting needs, navigate to our contact form or email us at info@basispointstech.com.