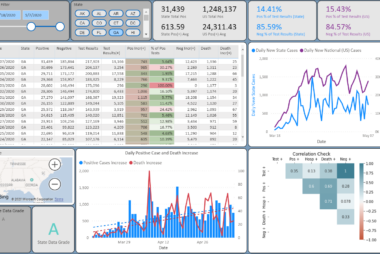
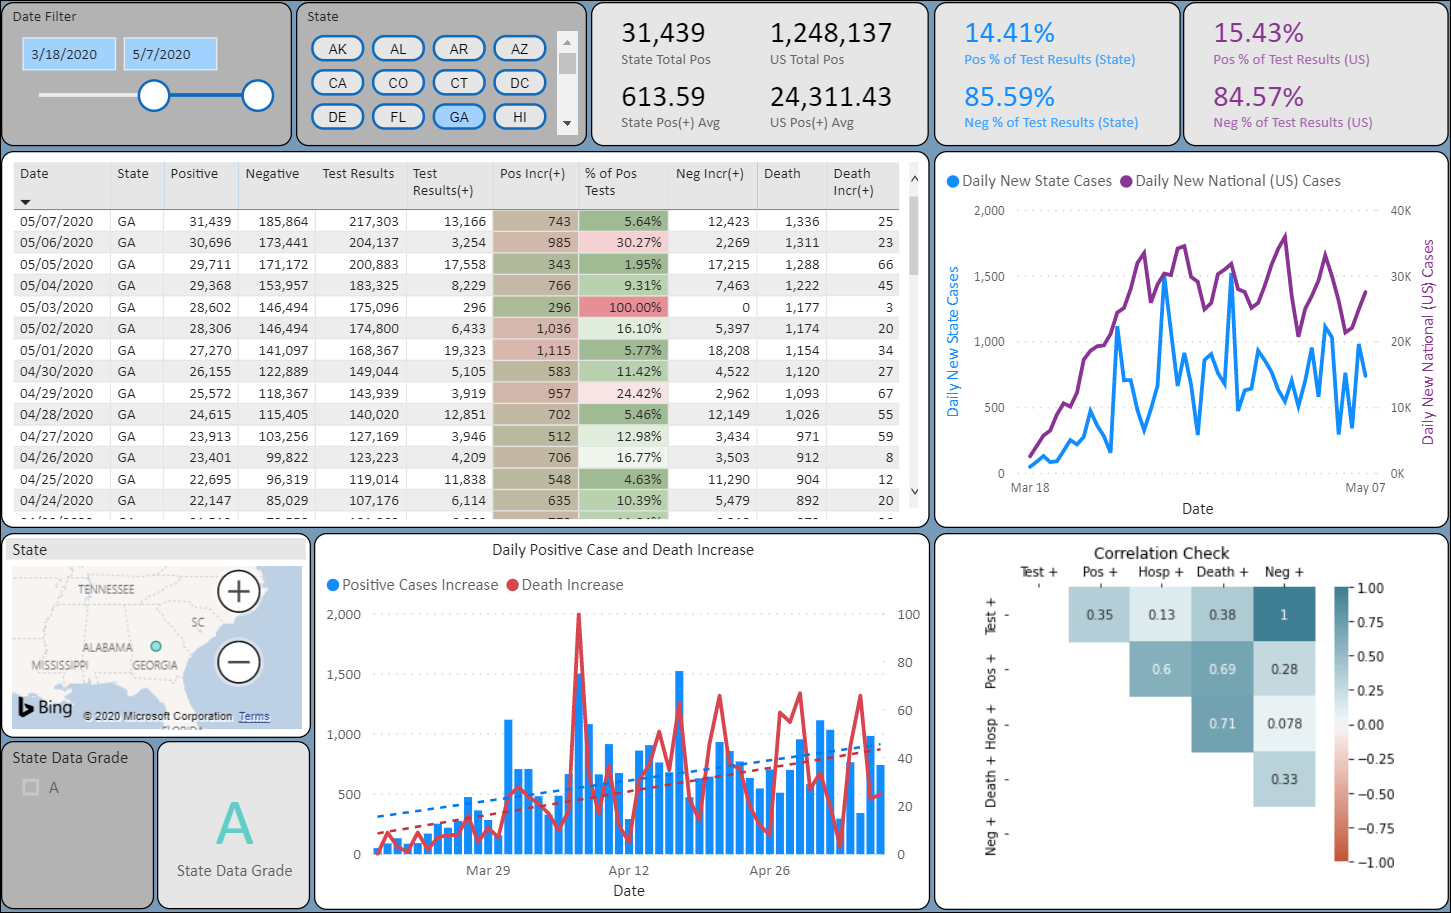
Not to jump on the coronavirus dashboard/reporting bandwagon, but we have been tinkering with a Covid-19 dashboard of our own. We wanted to drill into state levels a little further to monitor the scope and our collective progress towards combating the pandemic in our own backyard.
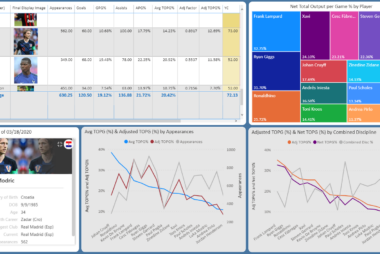
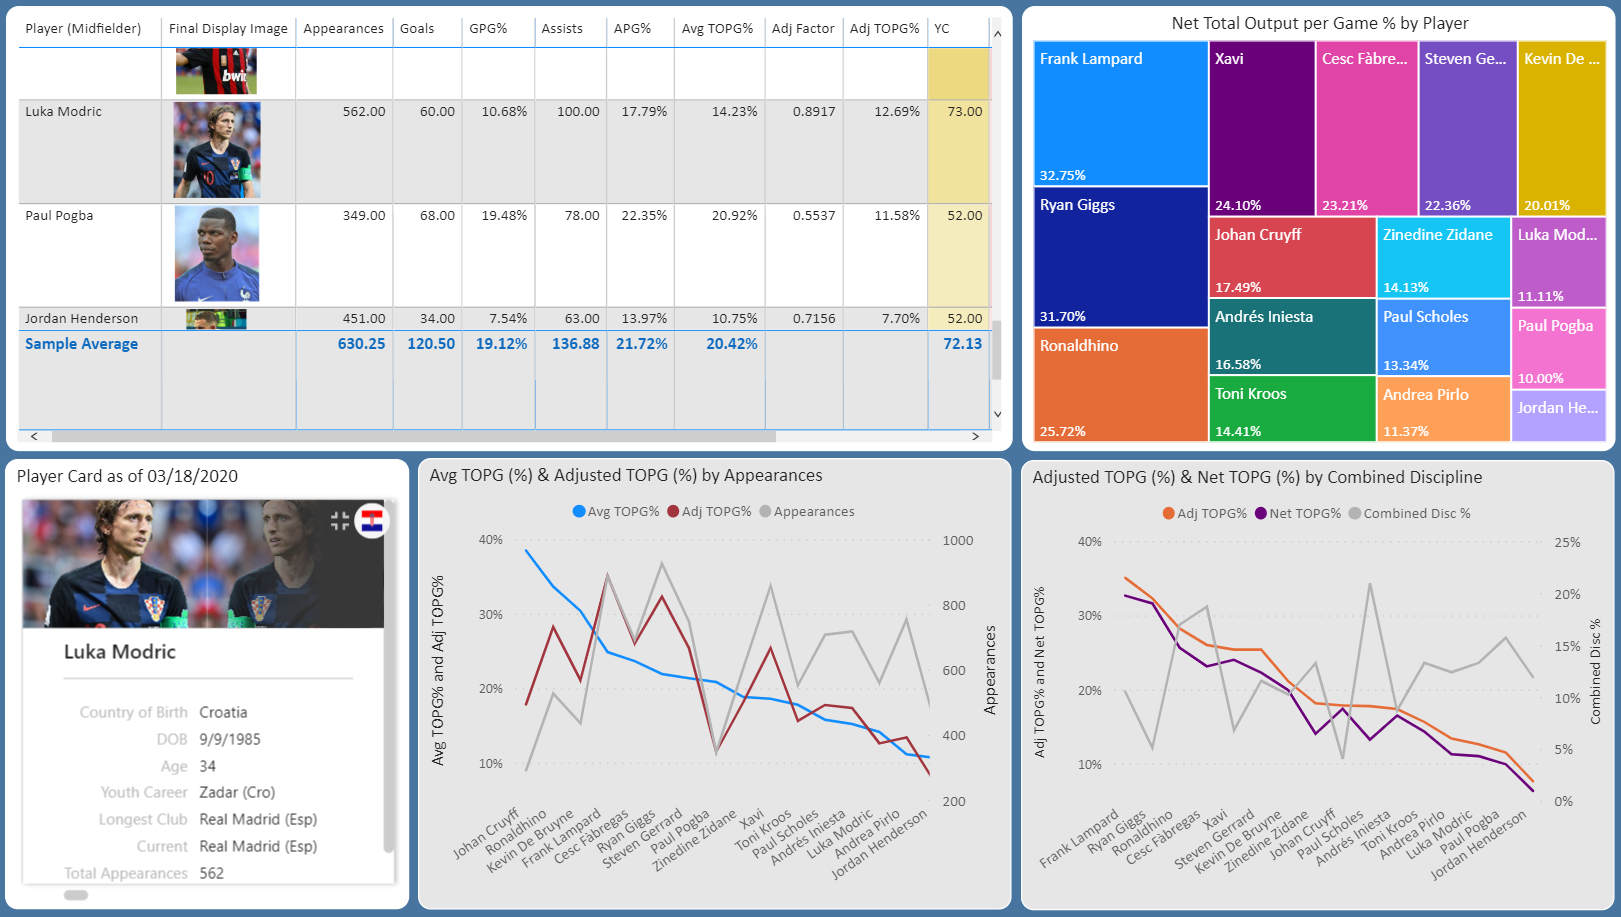
Here at Basis Points Technology, we seek out opportunities to enrich our learning even if the work strays from actual work. In this case, we employed our passion for soccer (football) to devise a fun way of visualizing data. (Football remains in our minds even though sports organizations rightfully suspended activities due to the Coronavirus pandemic.)
We have worked with our fair share of business intelligence (BI) tools, but Microsoft Power BI happens to be our favorite. It contains a lot of robust charting and reporting features, and it is well supported by the Microsoft ecosystem.
If you have toiled in the SQL Server, MS Access, and Excel woods throughout your career, then Power BI is a logical next step if you are curious about working with a business intelligence platform.
