Spreadsheet applications such as Microsoft Excel, Google Sheets, and Airtable can perform many invaluable functions for an individual or company team. Financial analysts, managers, and technologists use them for data analysis, record tracking, calculating, forecast/modeling, and even as small-scale applications.
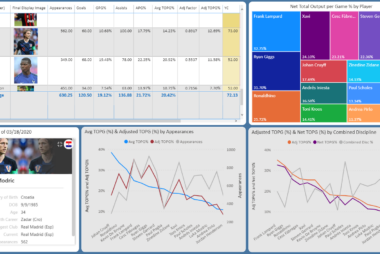
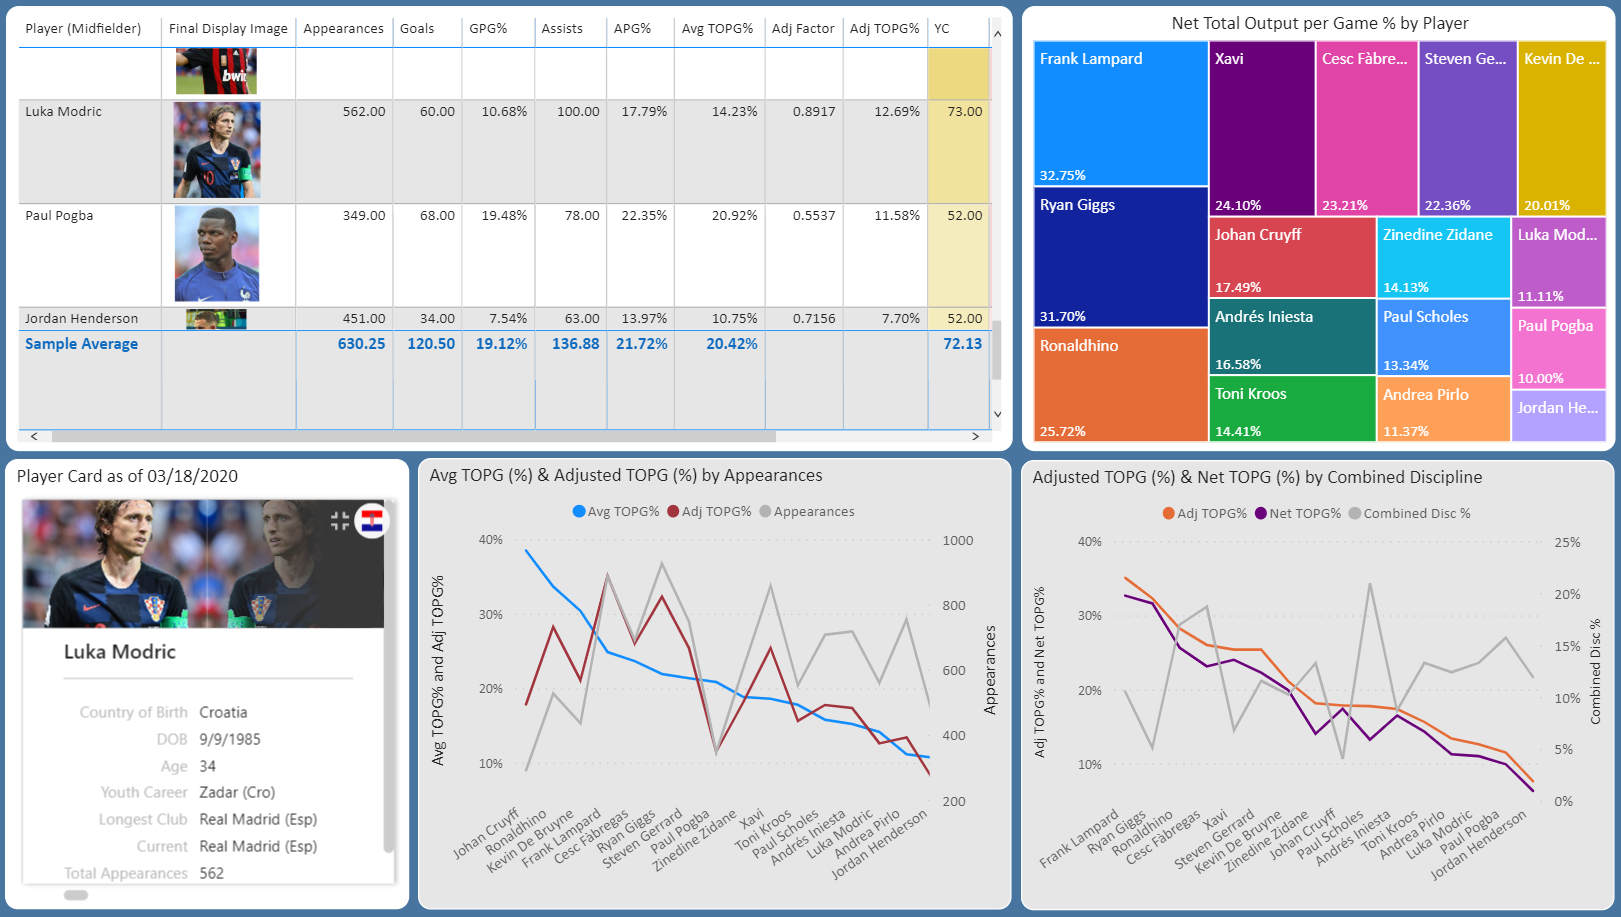
Here at Basis Points Technology, we seek out opportunities to enrich our learning even if the work strays from actual work. In this case, we employed our passion for soccer (football) to devise a fun way of visualizing data. (Football remains in our minds even though sports organizations rightfully suspended activities due to the Coronavirus pandemic.)
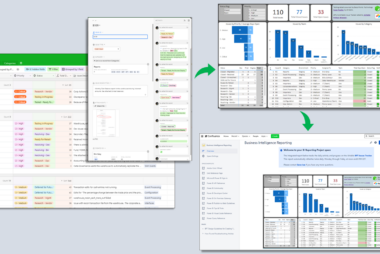
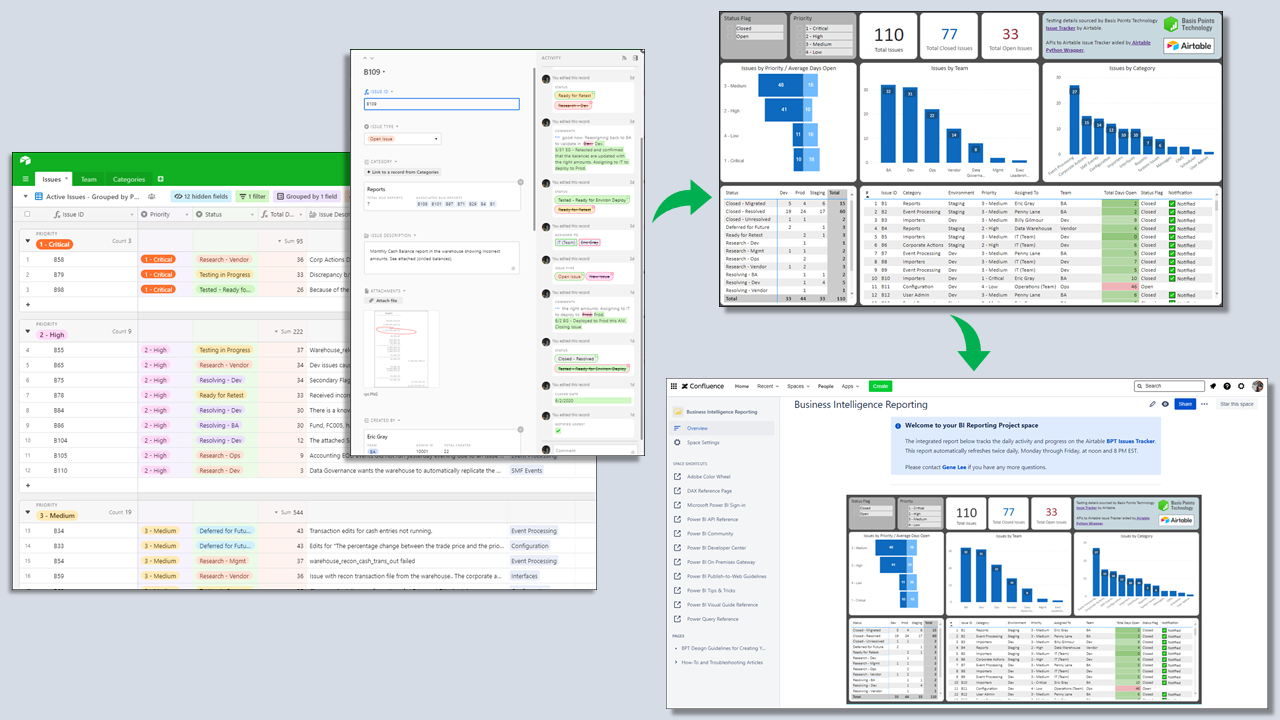
Our client brought us a complex data problem occurring in one of their back-office report extracts to see if we could determine the root cause.
The daily records for the combined datasets reached into the multiple thousands, so we needed a robust analysis tool that would help us “reverse engineer” through all the data to uncover our client’s data mystery. The other major challenge that we had to overcome was how to take three separate sets of unnormalized legacy data and pore through it effectively and efficiently.
In 2017, we initiated a fixed income risk project with a tier 1 asset manager based in the Midwest. But our priorities shifted as the deadline for the European Union’s MiFID II directive rapidly approached and the project needed our assistance.


